The Latest News

Success is Trending: High academic standards advancing equity in education

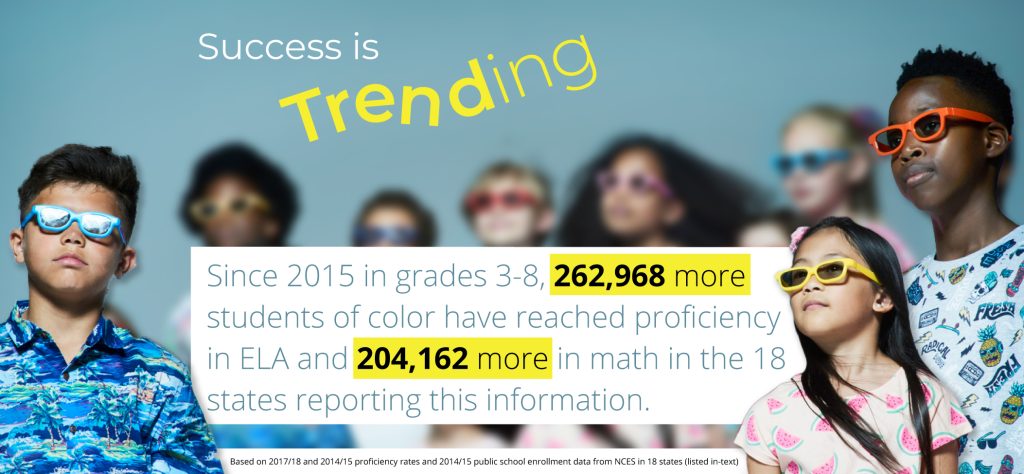 High academic standards are helping states level the playing field for all students, and results from assessments aligned with those standards show that we are making progress toward the goal of achieving equity in education. This is promising news. Trends in annual school system assessment scores have shown that significant gains are being made year after year for students of color in reaching grade-level proficiency. This is having real impact for real families; since 2015, hundreds of thousands more students of color are now proficient in English and math. These consistent gains within school systems in performance on annual assessments, indicate greater opportunities for future success in college and careers – no matter where students live, how much their parents make, or their race or ethnicity.
One of the greatest benefits of assessments aligned to consistent standards is the ability to monitor the progress of all students over time, particularly those students who are most vulnerable or have not historically been served well by the education system. Though there’s still much important work to be done, trends among traditionally-underserved students display encouraging results and growth for the future. This evidence can – and should – be put to work to continue finding ways to help all students succeed.
An analysis of data from the eighteen states that have released information by subgroup for 2015–2018 shows promising results on how students have performed on annual state assessments in math and English language arts (ELA). This memo looks at data for students of color in: AZ, CA, CO, DC, DE, ID, IL, KY, MD, MN (ELA only), NC, NH, NJ, NM, OR, UT, VT, and WA.1 Mapping out this data allows us to see progress in terms of the estimated number of students achieving grade level proficiency since the 2015 school year.2
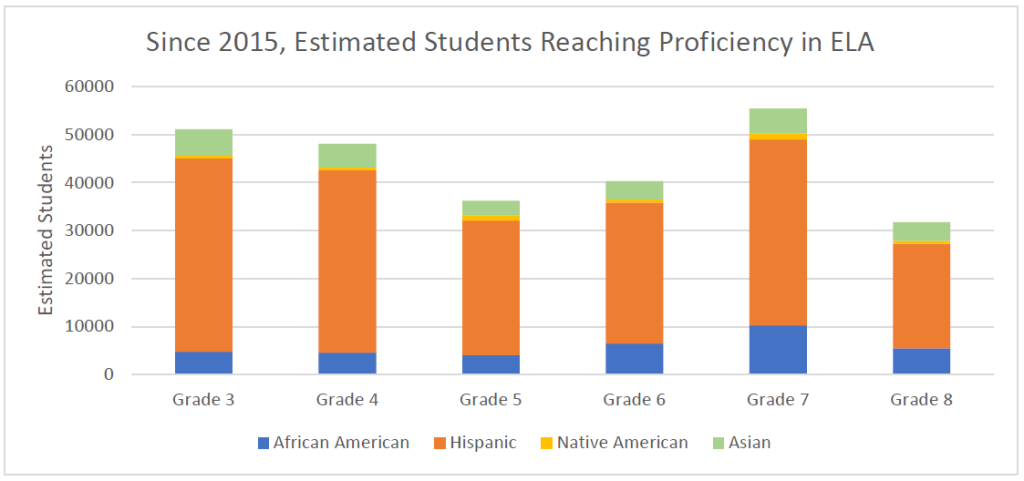
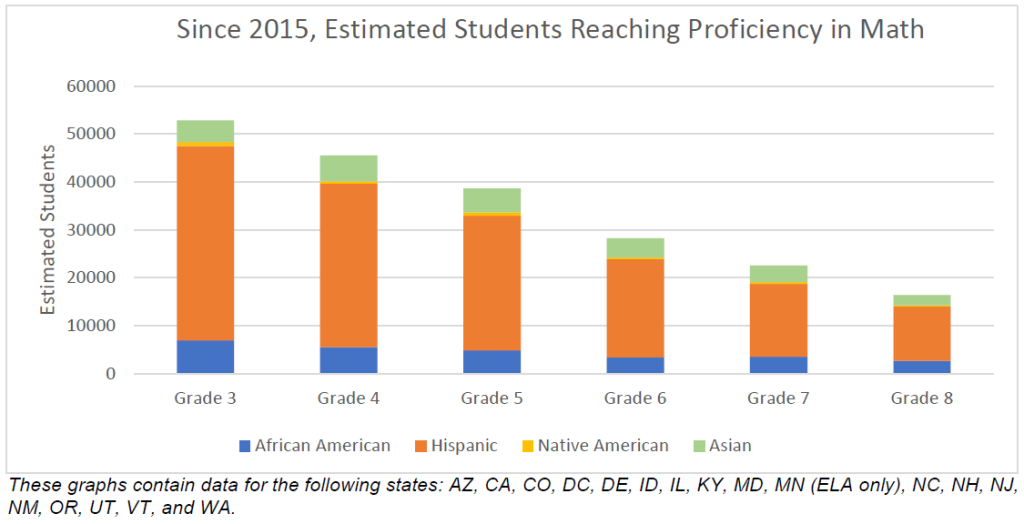
It is important to note that in some states there are wide differences in the student population. The student subgroups in the graphs above should not be compared directly, as the population of subgroups can vary greatly in terms of demographics within a state. In reviewing percentage improvements within subgroups below, it is clear that all students are making gains, and the graphs above tell a more complete story when viewed as a whole. For example, student proficiency improved as follows in ELA:
- African American students: 3.4 percentage points
- Hispanic students: 4.4 percentage points
- Native American students: 4 percentage points
- Asian students: 4.5 percentage points
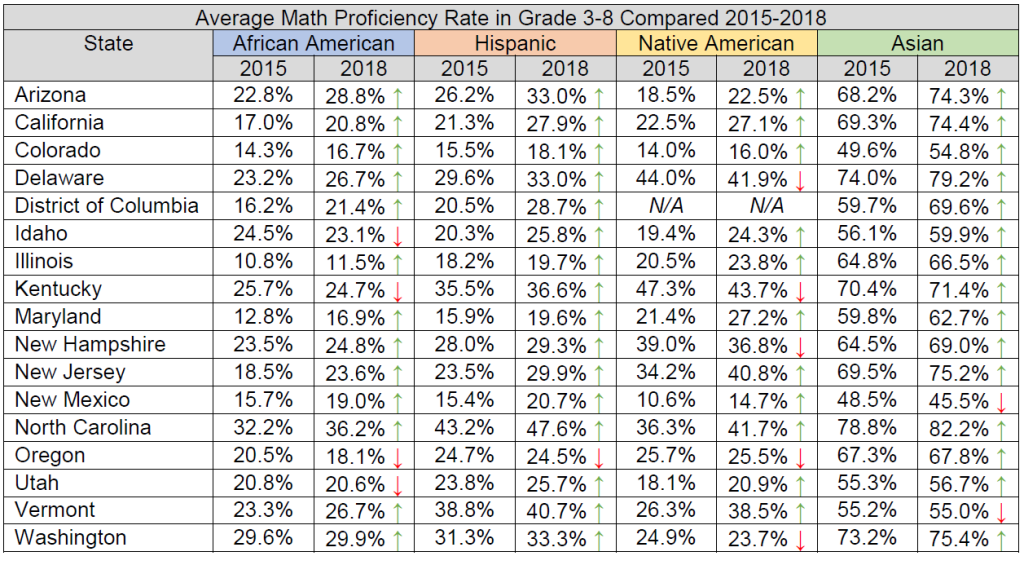
Improvement in proficiency in math across these states was:
- African American students: 2.5 percentage points
- Hispanic students: 3.7 percentage points
- Native American students: 3.4 percentage points
- Asian students: 3 percentage points
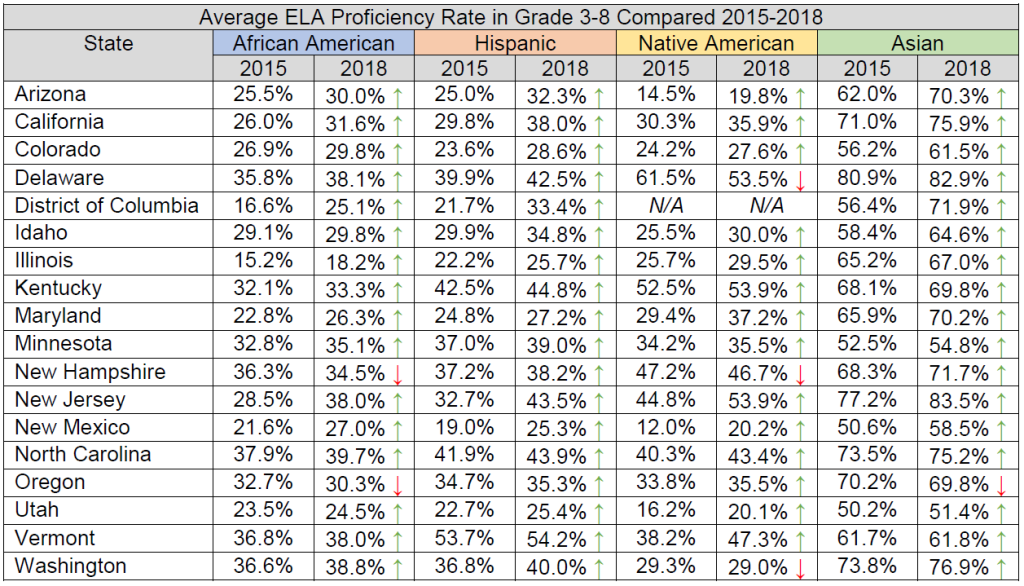
The charts below detail how student proficiency rates among all subgroups improved in a majority of states in both ELA and math from 2015 to 2018. Across the 18 states whose assessment score trends were reviewed for ELA:
- African American students made progress in 16 states
- Hispanic students made progress in all 18 states
- Native American students made progress in 14 states
- Asian students made progress in 17 states
Across the 17 states reviewed for math:
- African American students made progress in 13 states
- Hispanic students made progress in 16 states
- Native American students made progress in 14 states
- Asian students made progress in all 17 states
In addition to scores improving in the vast majority of states analyzed, in two states (CA, NC) the achievement gap between African American and Hispanic students with their white peers narrowed in math and the gap in ELA narrowed in eight states (CA, CO, DC, MN, NC, NH, NM, and WA). While there are a number of states with gains, below are highlights from four states that have seen both gains as well as achievement gaps narrowing.
California
In a state with more than 12% of the nation’s public school students, proficiency rates among Hispanic students are increasing at a greater rate than the state’s average.3 In grades 3-8, Hispanic students have seen an average percentage point increase of 8.2 in ELA and 6.6 in math. This can be compared to 6.7 in ELA and 5.7 in math for all students in California.
Washington, DC
In Washington, DC – where African American students have historically had low proficiency rates – we are seeing encouraging progress. While all students in DC have consistently increased their test scores, African American students have shown proficiency rates in grades 3-8 increase by 8.5 and 5.2 percentage points in ELA and math, respectively. Additionally, 7PthP grade ELA scores have nearly doubled since 2015, with 30.1% of students testing on grade level in 2018.
New Mexico
Native American students in grades 3-8 in New Mexico are showing above average gains in ELA, with an 8.1 percentage point increase in proficiency rates compared to the state average of a 6.4 percentage point increase. They are also gaining ground in math, with improvements nearly one percentage point shy of the state average of 5.3. Alongside their Native American peers, Hispanic students in grades 3-8 are meeting the state average in both ELA (6.4) and math (5.3), showing strong progress over the last four years.
New Jersey
African American and Hispanic students in New Jersey have made remarkable gains in ELA in grades 3-8. African American students have seen an average percentage point increase of 9.5 in ELA since 2015, and Hispanic students have seen an average percentage point increase of 10.9 in the same time period. By comparison, the state average is a 7.8 percentage point increase in ELA.
In California, New Jersey, New Mexico, Washington, DC, and other states, gains among students of color have contributed to strong overall improvements in performance for all students. Of course, continuous gains do not happen accidentally. We encourage further research and exploration into the policies and practices that contribute to increasing equity in education. The progress we have seen shows that higher standards and aligned assessments are contributing factors and provide hope that these trends – guided by strong state leadership – will continue toward a successful future for students of color.
1. States where disaggregated data was accessible to the public at the time of initial data collection.
2. Estimates are based on the average percentage point increase in these 18 states by grade multiplied by the 2014-15 school year enrollment data from the National Center for Educational Statistics.
3. Percentage taken from National Center for Educational Statistics and California Department of Education 2018 enrollment data.
About the Collaborative for Student Success
At our core, we believe leaders at all levels have a role to play in ensuring success for K-12 students. From ensuring schools and teachers are equipped with the best materials to spotlighting the innovative and bold ways federal recovery dollars are being used to drive needed changes, the Collaborative for Student Success aims to inform and amplify policies making a difference for students and families.
To recover from the most disruptive event in the history of American public schools, states and districts are leveraging unprecedented resources to make sure classrooms are safe for learning, providing students and teachers with the high-quality instructional materials they deserve, and are rethinking how best to measure learning so supports are targeted where they’re needed most.